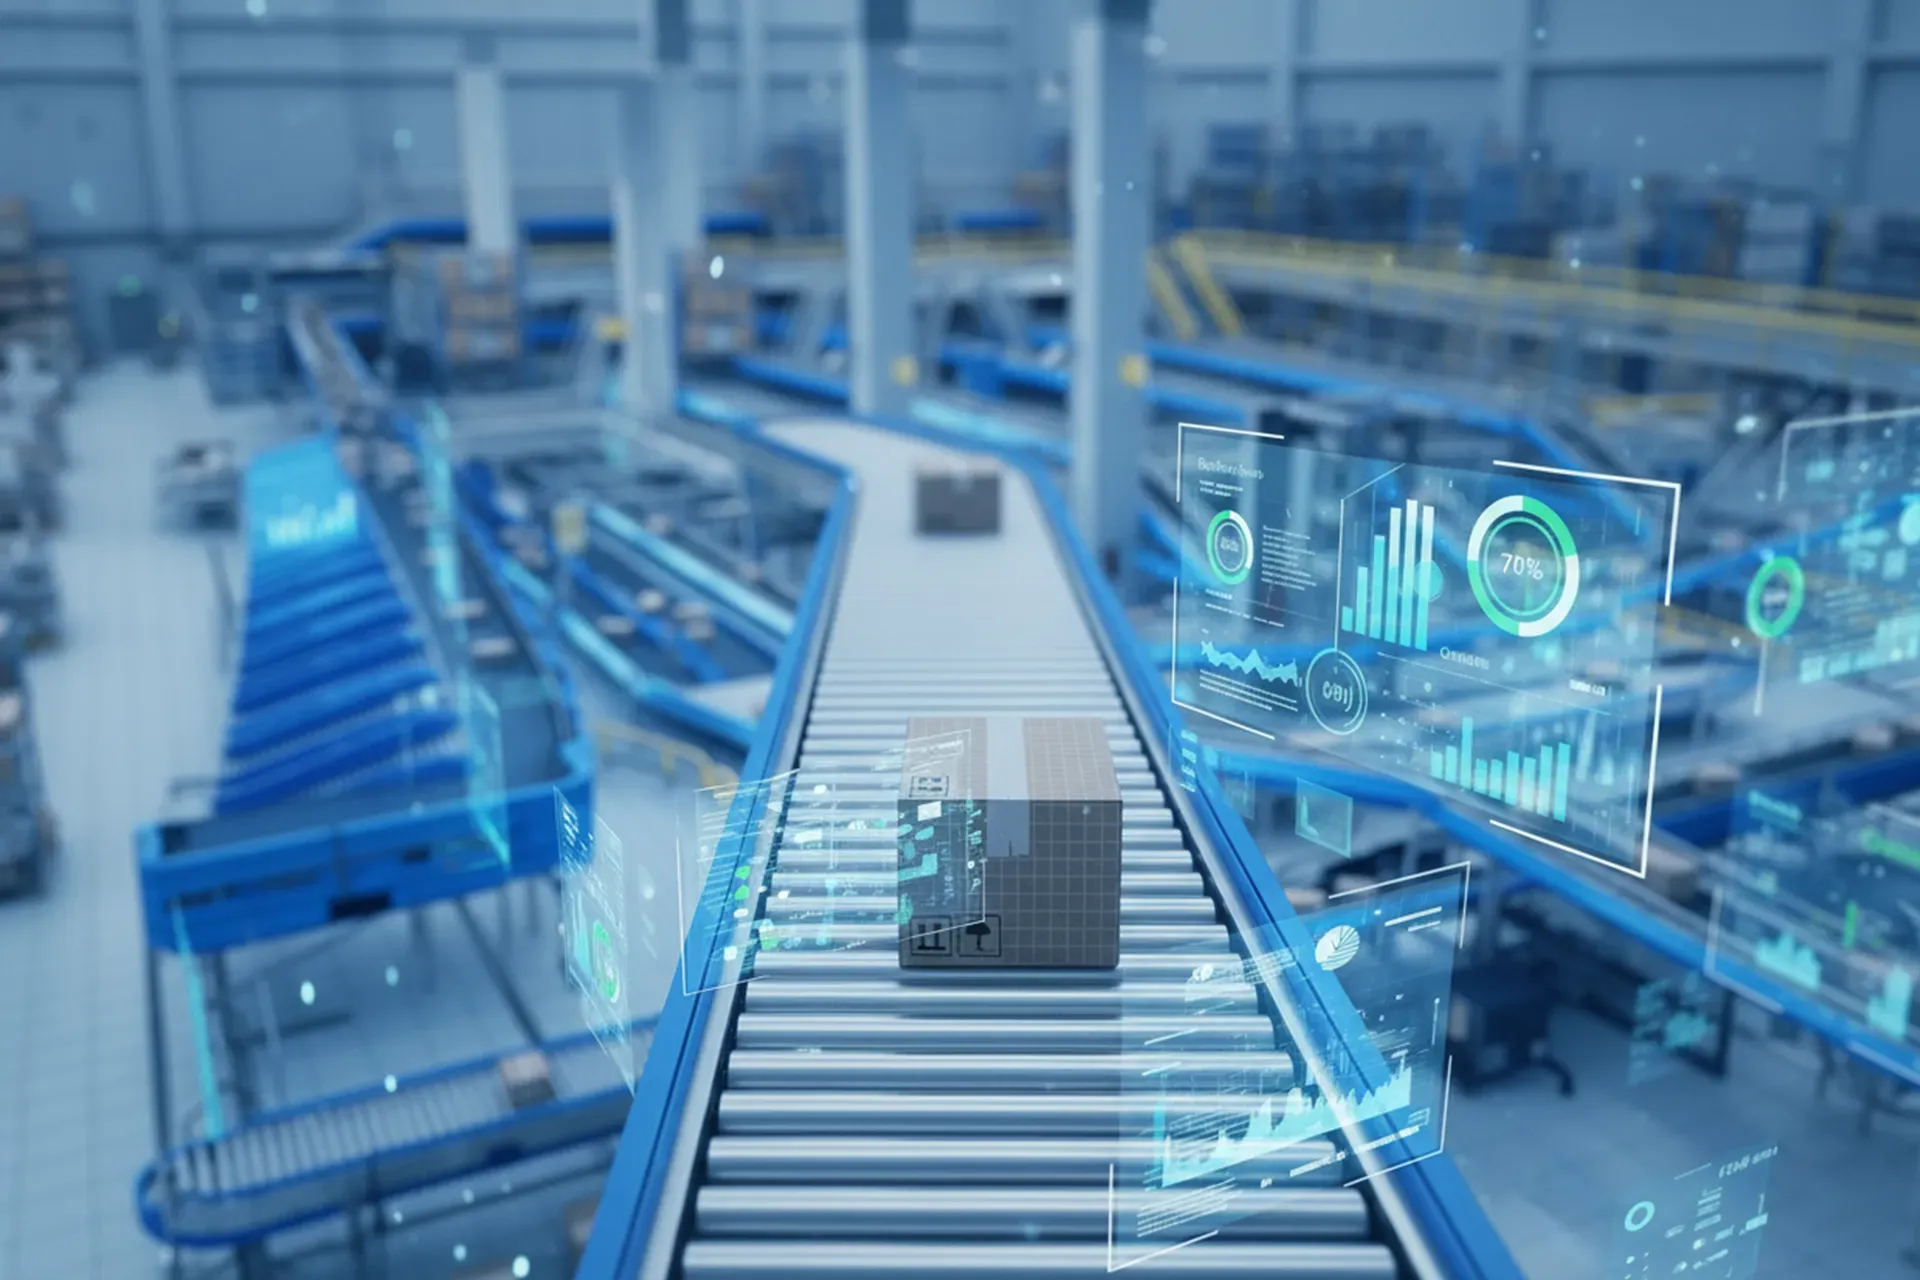
Tracking the right KPIs with supply chain simulation software provides essential insights into operational performance, bottlenecks, and optimization opportunities. Key metrics include throughput rates, cycle times, inventory levels, resource utilization, and cost indicators that reveal system efficiency. These performance indicators help organizations make data-driven decisions about process improvements, capacity planning, and investment priorities before implementing changes in real-world operations.
What are the most important KPIs to track in supply chain simulation?
The most critical KPIs in supply chain simulation include throughput rates, cycle times, inventory levels, resource utilization, and total cost metrics. These core indicators provide comprehensive visibility into system performance, revealing how efficiently materials flow through your network and where constraints limit capacity.
Throughput metrics measure the volume of goods processed within specific timeframes, helping you understand maximum system capacity and identify peak performance periods. Cycle time tracking reveals how long products take to move through each process stage, highlighting delays and inefficiencies that impact customer delivery times.
Resource utilization KPIs show how effectively you’re using equipment, labor, and facilities. Low utilization rates may indicate overcapacity, while consistently high rates suggest potential bottlenecks. Inventory level monitoring helps balance carrying costs against stockout risks, ensuring optimal buffer levels throughout your network.
Cost-related KPIs encompass operational expenses, transportation costs, and inventory carrying costs. These financial indicators help quantify the economic impact of different scenarios and justify improvement investments through clear return calculations.
How do operational KPIs differ from financial KPIs in supply chain simulation?
Operational KPIs focus on physical performance metrics like lead times, capacity utilization, and delivery performance, while financial KPIs measure economic outcomes including total cost of ownership, return on investment, and cost per unit. Understanding this distinction helps prioritize improvements based on current business objectives.
Operational metrics provide immediate insights into system functionality and efficiency. Lead times reveal how quickly orders move through processes, capacity utilization shows equipment and labor productivity, and delivery performance tracks service level achievements. These indicators help optimize day-to-day operations and identify tactical improvements.
Financial KPIs translate operational performance into business impact. Total cost of ownership includes all expenses associated with running supply chain operations, from labor and equipment to facility and transportation costs. Return on investment calculations help evaluate whether process improvements justify their implementation costs.
Prioritizing operational KPIs makes sense when focusing on process optimization and efficiency gains. Financial KPIs become more important when evaluating strategic investments, comparing alternative solutions, or justifying budget allocations to senior management.
Which KPIs help identify bottlenecks and optimization opportunities?
Queue lengths, waiting times, resource idle periods, and throughput variations are the most effective KPIs for revealing system constraints and improvement opportunities. These metrics pinpoint exactly where delays occur and which resources limit overall system performance.
Queue length monitoring shows where work accumulates, indicating capacity mismatches between connected processes. Long queues suggest upstream processes are feeding work faster than downstream operations can handle, creating bottlenecks that limit total system throughput.
Waiting time analysis reveals how long items spend idle between processing steps. Extended waiting periods indicate scheduling inefficiencies, resource shortages, or process synchronization problems that reduce overall system velocity.
Resource idle time tracking identifies underutilized assets that could be redeployed or eliminated. High idle times may indicate oversized resources or poor scheduling, while zero idle time suggests potential capacity constraints that could benefit from additional resources.
Throughput variation measurements highlight inconsistent performance that affects reliability and planning. High variation indicates unstable processes that require investigation and standardization to improve predictability. Using a discrete event simulation software environment makes it significantly easier to isolate these variations and test corrective measures without disrupting live operations.
What customer service KPIs should you monitor through simulation?
On-time delivery rates, order fulfillment accuracy, service level agreements, and customer satisfaction indicators are essential customer service KPIs that directly impact business relationships and competitive positioning. These metrics help balance operational efficiency with service quality requirements.
On-time delivery performance measures how consistently you meet promised delivery dates. This KPI directly affects customer satisfaction and retention, making it crucial for maintaining competitive advantage. Supply chain simulation software helps test how different scenarios impact delivery reliability.
Order fulfillment accuracy tracks how often complete, correct orders reach customers without errors. Poor accuracy rates increase costs through returns, replacements, and customer service interactions while damaging brand reputation.
Service level agreement compliance measures how well you meet contractual commitments to customers. These agreements often include delivery timeframes, product availability, and quality standards that require careful monitoring and optimization.
Customer satisfaction indicators, though sometimes indirect in simulation models, can be estimated through delivery performance, order completeness, and response times. These metrics help evaluate how operational changes might affect customer experience. This is particularly relevant in warehouse and distribution environments, where warehouse simulation software can model the full order cycle and expose service risks before they reach the customer.
How do you measure the ROI of supply chain improvements using simulation KPIs?
ROI measurement involves comparing baseline performance metrics with optimized scenarios to calculate cost savings, efficiency gains, and risk reduction benefits. This framework provides quantifiable justification for improvement investments and helps prioritize optimization efforts.
Establish baseline measurements for all relevant KPIs before testing improvement scenarios. Document current throughput rates, cycle times, resource utilization, and cost metrics to create comparison benchmarks for evaluating potential changes.
Model proposed improvements in your simulation environment and measure the same KPIs under optimized conditions. Calculate percentage improvements in throughput, reductions in cycle time, and changes in resource requirements to quantify operational benefits.
Translate operational improvements into financial impact by calculating cost savings from reduced labor requirements, improved asset utilization, and decreased inventory carrying costs. Include revenue benefits from increased capacity and improved customer service performance. In facilities that rely on automated equipment such as conveyors or AS/RS systems, material flow simulation and automated storage and retrieval system simulation can be especially valuable for quantifying the gains that automation investments are expected to deliver.
Factor in implementation costs and timeframes to calculate net ROI. Consider both one-time investment costs and ongoing operational changes to determine payback periods and long-term value creation from proposed improvements.
How Enterprise Dynamics helps with supply chain KPI tracking
Enterprise Dynamics provides comprehensive KPI tracking capabilities through integrated analytics, automated reporting, and real-time performance monitoring. Our simulation platform enables organizations to measure, analyze, and optimize supply chain performance with precision and confidence. As a fully featured DES simulation platform, it supports the complete range of supply chain, logistics, and manufacturing scenarios within a single, consistent environment.
Key benefits include:
- Built-in KPI dashboards that automatically calculate and display critical performance metrics
- Real-time data visualization showing throughput, utilization, and bottleneck analysis
- Automated report generation for comparing baseline and optimized scenarios
- Integration capabilities with existing WMS and ERP systems for accurate data inputs
- Customizable metrics tracking tailored to your specific operational requirements
Ready to optimize your supply chain performance through comprehensive KPI tracking? Contact our team to discover how Enterprise Dynamics can provide the insights you need to make confident, data-driven supply chain decisions.
Related Articles
- What are the four types of simulations?
- How does simulation help warehouses adapt to changing order profiles?
- What industries benefit most from supply chain simulation software?
- How can simulation software improve warehouse efficiency?
- What is the difference between supply chain simulation software and a digital twin?