Warehouse layout simulation helps you compare vendor automation solutions by running each proposal through the same virtual model of your operation, so you can see exactly how each system performs under your actual conditions before signing any contracts. Instead of relying on vendor-supplied benchmarks or theoretical throughput numbers, warehouse simulation software lets you stress-test competing proposals against your real order profiles, SKU mix, and peak demand scenarios. The sections below unpack exactly how that process works, what you need to make it fair, and how to turn the results into negotiating power.
What can warehouse layout simulation actually test before you commit?
Warehouse layout simulation can test throughput capacity, bottleneck behavior, equipment utilization, labor requirements, and system resilience under peak and failure conditions, all within a virtual replica of your facility before a single piece of equipment is installed. This means you evaluate performance against your own operational reality, not a vendor’s best-case scenario.
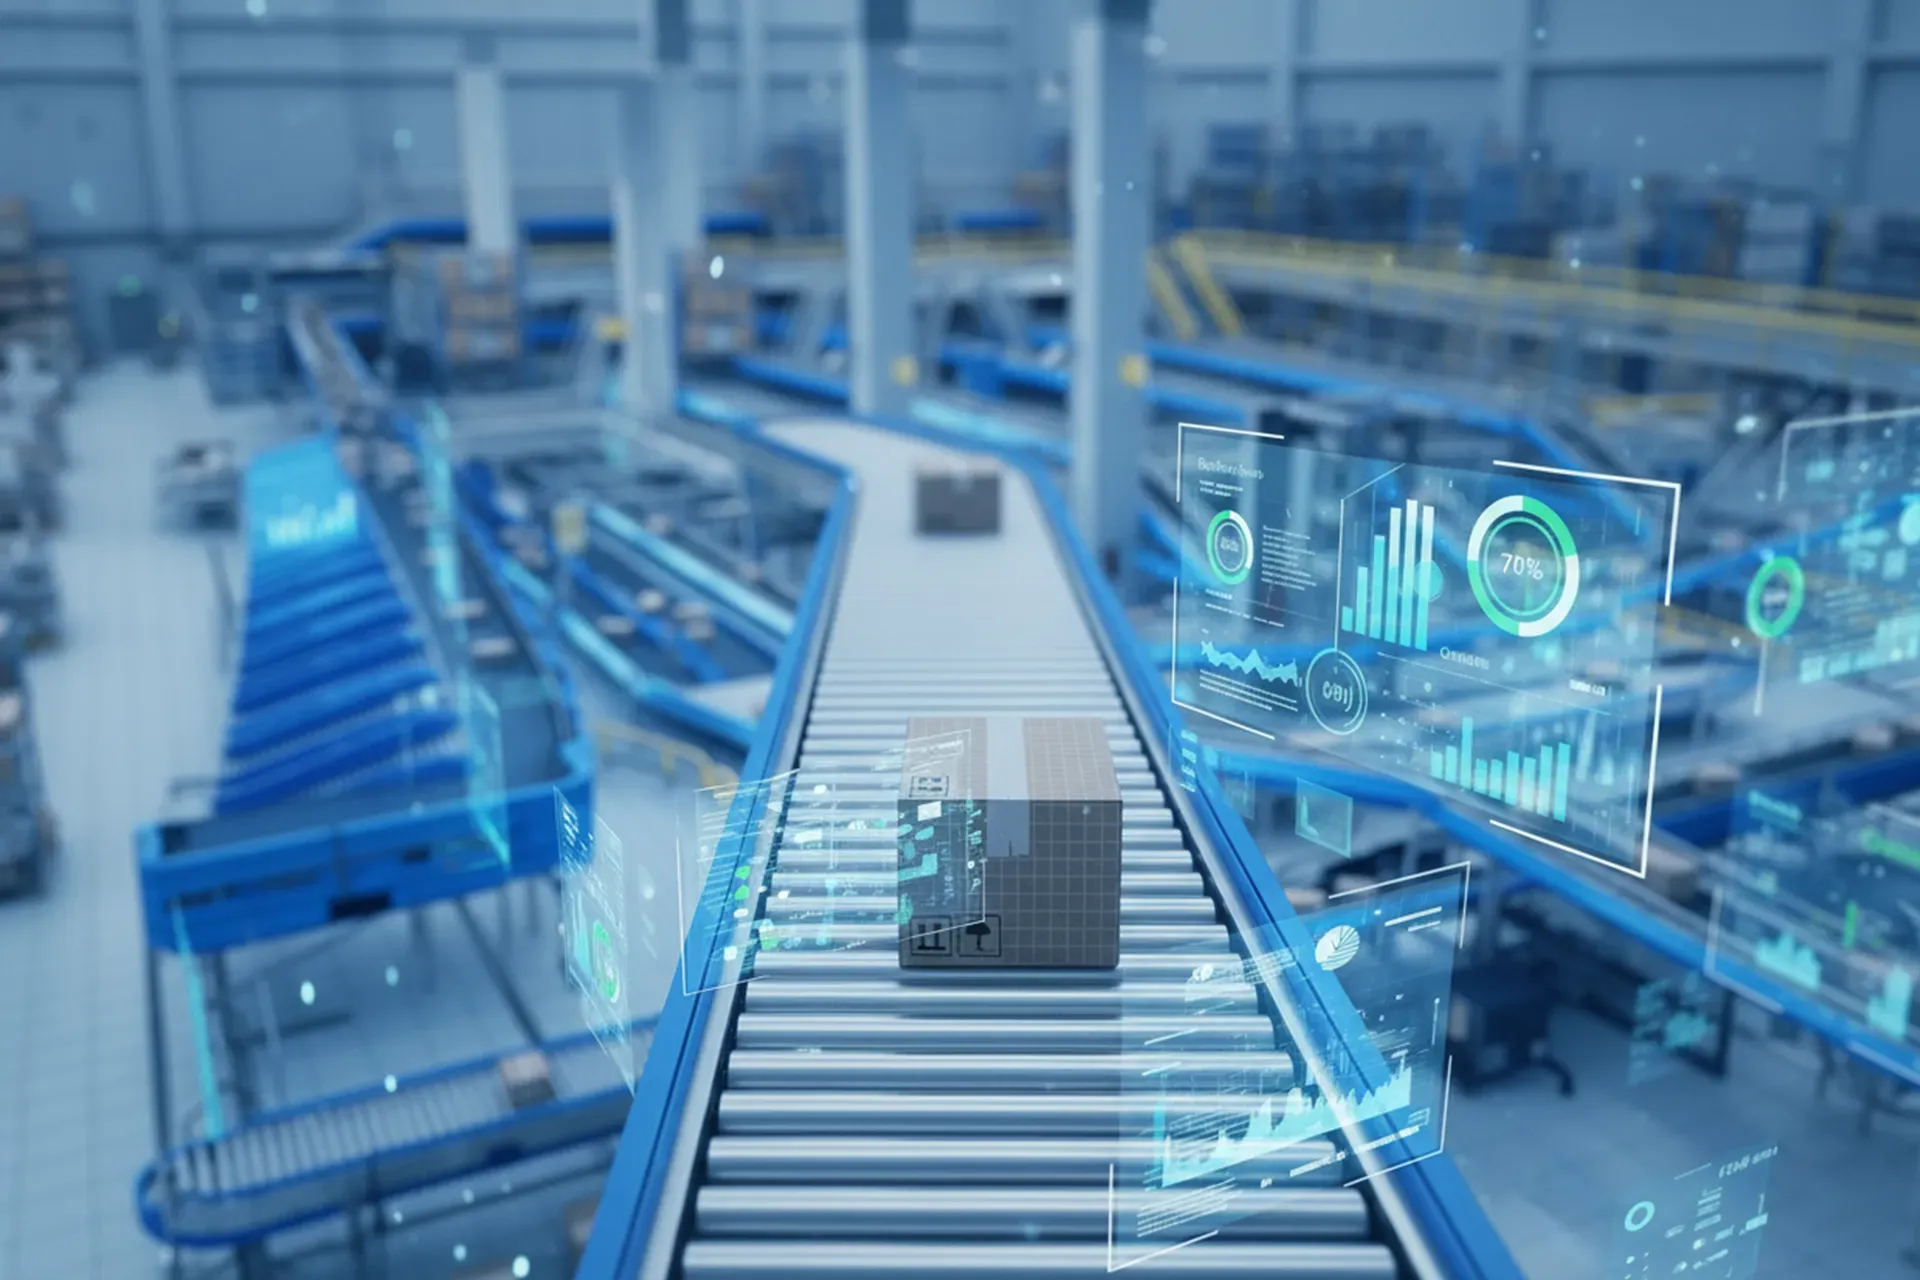
In practical terms, a warehouse simulation software model of your facility can answer questions that no spreadsheet or vendor presentation can reliably address:
- Throughput under peak demand: How many orders can the proposed system process during your busiest hours or seasonal peaks?
- Bottleneck location: Where does congestion build when inbound and outbound volumes spike simultaneously?
- Equipment utilization rates: Are conveyors, sorters, or automated storage and retrieval systems running at efficient rates, or are they idle or overloaded?
- Failure and recovery behavior: What happens to overall throughput when one subsystem goes offline?
- Workforce interaction: How do human operators and automated systems interact during exceptions, replenishment, or returns processing?
Because the model runs in dynamic time rather than static calculations, it captures the ripple effects that only appear when a system is actually in motion. A conveyor that looks adequate on paper may become a chokepoint the moment two pick zones release orders simultaneously — exactly the kind of behavior that material flow simulation is designed to expose.
How does simulation reveal differences between vendor automation proposals?
Simulation reveals differences between vendor proposals by placing each design inside the same operational model and measuring how it actually behaves under identical conditions. Vendors often present their solutions using peak-performance figures measured in isolation. Discrete event simulation software exposes how each proposal handles your specific mix of variables together, which is where real differences emerge.
When two vendors propose different conveyor layouts, sortation technologies, or automated storage configurations, the intralogistics simulation runs each design through the same scenarios: your historical order wave patterns, your SKU velocity distribution, your inbound receiving rhythm. The output is a direct, apples-to-apples comparison of metrics like units per hour, queue lengths, pick-to-ship cycle times, and system recovery speed after a disruption.
Beyond raw throughput, warehouse automation simulation also surfaces architectural differences that are hard to spot in a proposal document. One vendor’s design might deliver higher average throughput but collapse under a specific peak condition. Another might show lower average performance but maintain consistent flow even when one zone is temporarily congested. Neither of these behavioral differences appears in a static specification sheet.
Build your own simulation, your way
Enterprise Dynamics gives developers full control to model, scale, and integrate complex systems with C++, APIs, and real-time data.
Explore Enterprise DynamicsWhat inputs do you need to run a fair vendor comparison in simulation?
A fair vendor comparison in simulation requires four categories of input: accurate facility data, real operational demand data, detailed vendor design specifications, and agreed-upon test scenarios. Without all four, the comparison risks favoring whichever proposal has the most generous assumptions built in.
Here is what each category should include:
- Facility data: Floor plan dimensions, column positions, dock door locations, ceiling heights relevant to automation, and any fixed infrastructure that cannot change.
- Operational demand data: Historical order profiles, SKU velocity curves, inbound shipment patterns, shift structures, and documented peak periods. The more granular, the better.
- Vendor design specifications: Equipment speeds, capacities, cycle times, buffer sizes, control logic assumptions, and any dependencies between subsystems. Both vendors must supply equivalent levels of detail.
- Test scenarios: A shared set of scenarios agreed upon before modeling begins, including average day, peak day, partial system failure, and ramp-up conditions. Using the same scenarios for both vendors is what makes the comparison genuinely fair.
One common mistake is allowing vendors to define their own test conditions. When each vendor chooses the scenario that makes their system look best, you end up comparing incompatible results. Defining the scenarios yourself, based on your actual operational data, is the step that transforms a DES simulation tool from a demonstration aid into a genuine decision-making instrument.
Which automation decisions benefit most from simulation comparison?
The automation decisions that benefit most from simulation comparison are those involving high capital investment, long operational commitment, or significant integration complexity. These are precisely the decisions where getting it wrong is expensive and difficult to reverse.
In practice, this covers a broad range of choices that warehouse and distribution center operators face regularly. Automated storage and retrieval system simulation is a natural fit when comparing AS/RS vendors, since capacity, speed, and scalability vary significantly between designs even when headline specs look similar. Conveyor simulation and sortation system selection are strong candidates as well, particularly when the proposed systems use different technologies or topologies that will interact differently with your pick and pack operations.
Decisions about goods-to-person versus person-to-goods fulfillment strategies also benefit enormously from simulation, because the right answer depends heavily on your specific SKU mix and order structure rather than general industry benchmarks. Similarly, any decision that involves phased implementation benefits from simulation comparison, since you need to understand how the system performs during each transition phase, not just at full build-out.
How do simulation results translate into vendor negotiation leverage?
Simulation results give you negotiation leverage by replacing vendor-controlled assumptions with your own independently verified performance data. When you can show a vendor exactly where their proposed design falls short under your specific conditions, you shift the conversation from marketing claims to engineering accountability.
Concretely, simulation results can support several negotiation positions. If the model shows that a vendor’s proposed buffer capacity is insufficient during your documented peak periods, you have a quantified basis for requiring a redesign or a larger buffer as part of the contract. If throughput targets stated in a proposal are only achievable under conditions your operation never actually sees, the simulation output makes that visible and gives you grounds to negotiate performance guarantees tied to realistic scenarios.
Simulation results also clarify the cost of choosing one design over another. If Vendor A’s system delivers higher throughput but requires more labor during exceptions, and Vendor B’s system delivers slightly lower throughput but operates more independently, the material handling simulation quantifies that trade-off in operational terms. That quantification lets you make a financially grounded decision rather than a preference-based one, and it gives you a documented rationale that satisfies the multiple stakeholders typically involved in a capital investment of this scale.
How Enterprise Dynamics helps you compare automation vendors with confidence
Enterprise Dynamics is our DES simulation platform built specifically for the kind of complex, high-stakes comparisons described throughout this article. It is designed for material handling, intralogistics, warehousing, and production environments, and it gives your engineering team the tools to model, test, and validate competing automation proposals in a risk-free virtual environment.
With Enterprise Dynamics, your team can:
- Build accurate 2D and 3D models of your facility using a drag-and-drop library of prebuilt warehouse and logistics components
- Integrate data directly from your WMS or ERP system to ensure the simulation reflects real operational demand rather than theoretical inputs
- Run multiple vendor scenarios under identical test conditions and compare KPIs such as throughput, utilization, queue behavior, and cycle time side by side
- Identify bottlenecks and failure points in each proposed design before any capital is committed
- Produce documented, data-driven outputs that support both internal decision-making and vendor negotiations
If you are evaluating automation vendors and want to base that decision on your own verified data rather than competing sales presentations, we are ready to help. Get in touch with our team to discuss how Enterprise Dynamics can support your vendor comparison process.
Frequently Asked Questions
How long does it typically take to build a simulation model for a vendor comparison?
The timeline depends on the complexity of your facility and the quality of data available, but most warehouse simulation models built for vendor comparison purposes take between two and six weeks to develop and validate. A simpler single-zone operation with clean historical data can be modeled faster, while a multi-level, multi-zone distribution center with complex order profiles will require more time. Investing in a thorough model upfront pays off significantly when the capital commitment being evaluated runs into the millions.
What if a vendor refuses to share detailed design specifications needed for the simulation?
A vendor’s reluctance to share detailed specifications — equipment speeds, buffer sizes, control logic assumptions — is itself a meaningful signal worth noting during your evaluation. You can address this by making detailed specification submission a formal requirement of the RFP process, so all vendors understand it is a condition of participation. If a vendor still withholds key data, you can model conservative estimates and flag the uncertainty explicitly in your results, which also becomes a negotiation point around contractual performance guarantees.
Can simulation account for future growth, or is it only useful for evaluating current operational conditions?
Simulation is actually one of the most powerful tools available for stress-testing scalability, making it highly valuable for evaluating how each vendor’s proposed design handles future growth scenarios. You can run the same vendor proposals through projected demand levels — say, 150% or 200% of current volume — to see which architecture scales more gracefully and which hits a hard ceiling. This is especially important for phased implementation decisions, where you need confidence that the system you install today can accommodate the build-out planned for years two and three.
How do we validate that our simulation model is accurate before using it to make a major decision?
Model validation is a critical step that should happen before any vendor scenarios are tested. The standard approach is to model your current operation — using your existing layout, equipment, and workflows — and then compare the simulation output against your actual historical performance data. If the model reproduces your real throughput, cycle times, and utilization rates within an acceptable margin, you have a validated baseline. Any significant discrepancy signals a gap in your inputs or modeling logic that needs to be resolved before the comparison results can be trusted.
Is warehouse simulation only practical for large distribution centers, or can smaller operations benefit too?
While simulation is most commonly associated with large, high-throughput distribution centers where the capital stakes justify the investment, smaller operations can absolutely benefit — particularly when they are considering automation for the first time. For a smaller facility, the risk of choosing the wrong automation architecture is proportionally just as significant, since there is often less operational flexibility to compensate for a poor fit. Platforms like Enterprise Dynamics offer prebuilt component libraries that reduce modeling effort, making the approach more accessible even when internal engineering resources are limited.
What are the most common mistakes teams make when running a simulation-based vendor comparison?
The single most common mistake is allowing vendors to define their own test scenarios, which produces results that cannot be meaningfully compared. Other frequent pitfalls include using incomplete or unrepresentative demand data — such as an average week instead of a documented peak period — and failing to model failure conditions, which means the comparison only reflects best-case behavior. Building your test scenario set from your own operational data, including edge cases, before any vendor modeling begins is the most effective way to avoid all three of these errors.
Can simulation results be shared directly with stakeholders who are not familiar with simulation methodology?
Yes, and translating simulation outputs into stakeholder-friendly formats is an important final step in the process. Most simulation platforms, including Enterprise Dynamics, generate visual outputs such as 3D animations, throughput charts, and side-by-side KPI dashboards that make the results accessible to finance, operations, and executive stakeholders without requiring any simulation expertise to interpret. Pairing these visuals with a clear narrative that ties each metric back to a business outcome — labor cost, order cycle time, risk of downtime — ensures the results support confident decision-making across all levels of the organization.
Related Articles
- Can warehouse simulation software be used to train warehouse control algorithms?
- How does warehouse simulation software handle high object-count models?
- How to avoid supply chain risks?
- How can supply chain simulation software improve supply chain resilience?
- What is the difference between supply chain simulation software and a digital twin?